The Silent Threat
Introduction & Clinical Narrative
As healthcare transitions heavily into a preventive model, clinical focus has shifted sharply toward intermediate metabolic states. Prediabetes has emerged as one of the most critical windows for therapeutic intervention in modern practice. Data reveals a ticking time bomb: According to the comprehensive ICMR-INDIAB national study, over 136 million individuals are currently living with prediabetes. This massive cohort represents roughly 15.3% of the adult population who are standing at a critical crossroad.
What makes this clinical phase profoundly dangerous is its silent nature. From a metabolic standpoint, significant vascular, microvascular, and multi-organ damage begins accumulating long before fasting plasma glucose crosses the threshold into type 2 diabetes. Identifying this state early is not just a diagnostic milestone—it is our best opportunity to reverse a lifetime of chronic illness.
Pathophysiology
Cellular Mechanism of Dysglycemia
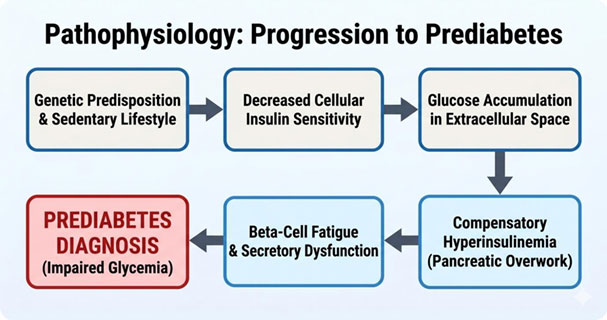
The transition from normal glucose tolerance to prediabetes is driven by a dual-defect system: structural insulin resistance paired with progressive pancreatic beta-cell fatigue.
- Insulin Resistance: Skeletal muscle, adipose tissue, and hepatic cells develop a diminished sensitivity to circulating insulin. The insulin receptors fail to trigger the GLUT-4 transporter cascade efficiently, leaving glucose trapped in the extracellular space.
- Compensatory Hyperinsulinemia: In response to baseline hyperglycemia, pancreatic beta-cells drastically upregulate insulin production to force glucose into resistant cells.
- Beta-Cell Exhaustion: Over time, continuous secretory stress exhausts the pancreatic islet cells. Once beta-cell dysfunction outpaces compensation, postprandial and fasting glucose levels rise persistently, cementing the prediabetic stage.
Risk Factors
- Overweight and obesity
- Sedentary lifestyle
- Family history of type 2 diabetes
- Age above 45 years
- Hypertension and dyslipidemia
- Conditions such as polycystic ovarian syndrome
Epidemiology & Incidence
Real-World Statistics & Geographical Trajectory
The prevalence of impaired glucose regulation shows clear demographic and regional variations, influenced directly by rapid urbanization, physical inactivity, and dietary shifts toward high-carbohydrate, low-protein profiles.
- National Scale: 3% overall prevalence (approx. 136 million people).
- Urban vs. Rural Split: Urban centers show a high baseline (~16.4%), but rural sectors have caught up significantly (~15.2%), proving that metabolic shift is no longer strictly an urban issue.
- Regional Disparities: State-level screening highlights massive variation, with high-prevalence zones like Goa and Puducherry pushing past 25-26%, while other regions remain lower.
*Source: ICMR-INDIAB National Epidemiological Dataset
Clinical Manifestations
Signs & Symptoms
True to its classification as a silent syndrome, prediabetes rarely presents with classic symptoms like polyuria or polydipsia. Instead, clinicians must actively look for subtle cutaneous and systemic biomarkers of severe insulin resistance:
- Acanthosis Nigricans: Dark, hyperpigmented, velvety plaques localized within intertriginous tissue zones such as the posterior neck, axillae, and groin.
- Acrochordons (Skin Tags): Multiple benign skin tags clustering around the neck and upper torso, frequently co-existing with acanthosis nigricans.
- Postprandial Somnolence: Pronounced, persistent lethargy following carbohydrate-dense meals, driven by rapid glycemic spikes and subsequent reactive insulin surges.
Diagnostic Criteria
Laboratory Investigations
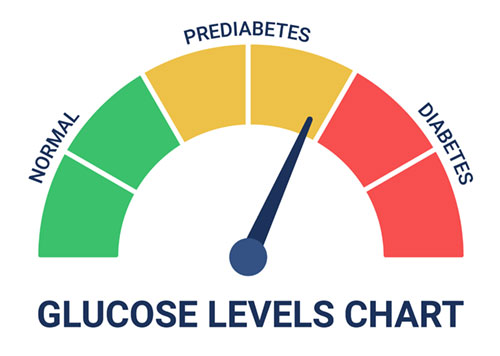
Definitive identification of prediabetes cannot rely on physical symptoms; it requires precise venous blood metrics. Clinical practice maps diagnosis across three primary biochemical pathways:
| Investigation | Normal Range | Prediabetes Range (Target) | Diabetes Threshold |
| HbA1c (Glycated Hemoglobin) | < 5.7% | 5.7% – 6.4% | ≥ 6.5% |
| Fasting Blood Glucose (FBG) | < 100 mg/dL | 100 – 125 mg/dL | ≥ 126 mg/Dl |
| Post-Prandial Blood Glucose | < 140 mg/dL | 140 – 199 mg/dL | ≥ 200 mg/Dl |
Management & Reversal
Evidence-Based Interventions
The most vital message of any prediabetes public health initiative is that it is entirely reversible. Because the beta-cells are fatigued but not destroyed, aggressive intervention can restore normal metabolic function.
Macro-Nutrient Restructuring:
lean proteins. Clinical data shows replacing just 1-2 servings of refined carbohydrates with clean protein can significantly reduce diabetes transition risks.
Targeted Physical Activity:
A minimum of 150 minutes per week of moderate-intensity aerobic exercise (brisk walking, cycling) paired with resistance training. Muscle contraction acts as an insulin-independent pathway for glucose clearance.
Strategic Weight Management:
Achieving a modest 5% to 7% reduction in total body weight lowers the structural risk of type 2 diabetes progression by nearly 60%.
Pharmacological Support:
In specific clinical profiles presenting high-risk indicators (e.g., BMI ≥ 35 kg/m², age < 60, or a documented history of gestational diabetes), pharmacological management with metformin along with GLP-A may be indicated alongside lifestyle modifications.

Dr. Parnambedu Lavanya MBBS, FCD
Registrar Department of Diabetology
Kauvery Hospital, Chennai