Statistical Regression Analysis
T. Dhasaratharaman*
Statistician, Kauvery Hospitals, India
Definition
The Regression Analysis is a technique of studying the dependence of one variable (called dependent variable), on one or more variables (called explanatory variable), with a view to estimate or predict the average value of the dependent variable in terms of the known or fixed values of the independent variables.
Regression analysis is used to find how one set of data relates to another.
This can be particularly helpful where we want to use one measure as a proxy for another – for example, a near-patient test as a proxy for a lab test.
Interpretation
A regression line is the “best fit” line through the data points on a graph.
The regression coefficient gives the “slope” of the graph, in that it gives the change in value of one outcome, per unit change in the other.
Example
Consider the graph shown in previous section. A statistician calculated the line that gave the “best fit” through the scatter of points
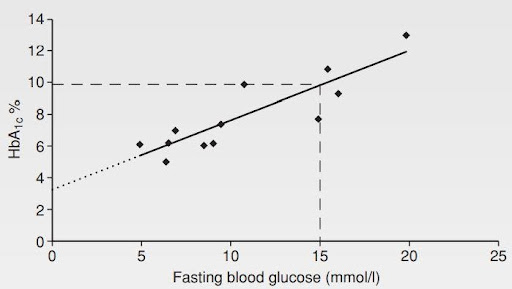
The line is called a “regression line”.
To predict the HbA1c for a given blood glucose the nurse could simply plot it on the graph, as here where a fasting glucose of 15 predicts an HbA1c of 9.95.
This can also be done mathematically. The slope and position of the regression line can be represented by the “regression equation”:
HbA1c = 3.2 + (0.45 × blood glucose).
The 0.45 figure gives the slope of the graph and is called the “regression coefficient”.
The “regression constant” that gives the position of the line on the graph is 3.2: it is the point where the line crosses the vertical axis.
Try this with a glucose of 15:
HbA1c =3.2+(0.45×15) = 3.2+6.75=9.95
This regression equation can be applied to any regression line. It is represented by:
y = a + bx
To predict the value y (value on the vertical axis of the graph) from the value x (on the horizontal axis), b is the regression coefficient and a is the constant.
Other types of regression
The example above is a “linear regression”, as the line that best fits the points is straight. Other forms of regression include:
Logistic regression: This is used where each case in the sample can only belong to one of two groups (e.g. having disease or not) with the outcome as the probability that a case belongs to one group rather than the other.
Poisson Regression: It is mainly used to study waiting times or time between rare events.
Cox proportional hazards regression model: It is used in survival analysis where the outcome is time until a certain event.
Caution
Regression should not be used to make predictions outside of the range of the original data. In the example above, we can only make predictions from blood glucoses which are between 5 and 20.
Regression vs correlation
Regression and correlation are easily confused.
Correlation measures the strength of the association between variables.
Regression quantifies the association. It should only be used if one of the variables is thought to precede or cause the other.
Kauverian Bookshelf
Applied Medical StatisticsJournals
- Managing Director Address
- Guest Editorial
- Tribute to Dr. Vasanthi Vidhyasagaran
- Editorial
- Anaesthetic management of lung resection in Covid associated pulmonary mucormycosis: A report of two cases
- Anaesthetic management of a patient with hyperthyroidism for total thyroidectomy
- Jet Ventilation: Traditional but Effective
- Hysterotomy under general anesthesia in a patient with peripartum cardiomyopathy
- From snake envenomation to recovery: A case report on rapid progression and reversal of multi-organ dysfunction
- Double jeopardy in airway management: Klippel- Feil syndrome with restricted neck extension and nasal polyp
- Pediatric temporomandibular joint ankylosis: A case report
- Self-limiting myoclonus following supraclavicular brachial plexus block with Ropivacaine: A rare incidence
- Total intravenous anaesthesia in tight airway
- Navigating the depths: USG for safe spinal in super obese parturient
- Reconstructing absence: Airway management in a rare craniofacial abnormality
- Anaesthetic management of severe aortic stenosis in a geriatric patient undergoing dynamic hip screw fixation
- Efficacy of pecto-intercostal fascial plane block in patients undergoing cardiac surgeries with midline sternotomy
- A case of idiopathic sub- annular outpouchings in LVOT: Emphasizing the importance of comprehensive intraoperative TEE examination in cardiac surgery
- Anaesthetic management of a patient with acute appendicitis and concurrent acute coronary syndrome: A perioperative challenge
- Anaesthetic management of an extremely low birth weight preterm neonate undergoing surgery for midgut malrotation: A case report
- Spinal myoclonus during combined spinal–epidural anaesthesia for bilateral total knee replacement: A rare intraoperative manifestation
- A case of pneumocephalus following an labour epidural: A lesson learnt
- Anaesthesia 2.0: Merging human expertise with AI
- Bridging with “silicone lifeline”: Anaesthetic management for montgomery T- tube placement in a complex laryngotracheal stenosis
- A challenging case of esophageal stenting in a patient with tracheoesophageal fistula under intravenous sedation: A case report
- Takotsubo cardiomyopathy post-adrenaline infiltration—in nasal surgery
- Foreward
- Editorial
- Approach to pediatric trauma: A comprehensive review
- Case series: Blood, steel, and resolve—a night of mass casualty trauma
- A prospective observational study on electrolytes imbalances in emergency patients at Kauvery Hospital, Cantonment
- Emergency diagnosis and management of C2 vertebrae fractures with artery rupture
- Post-Infectious Cerebellitis: A case report and approach to management
- A rare and potentially overlooked case of bilateral testicular dislocation
- Sumatriptan induced Hypertension: A case report
- Early diagnosis and treatment of Ramsay Hunt Syndrome
- Importance of standardization and evidence-based practice among nurses and its outcomes
- Penetrating neck trauma
- Reanimate life within one hour of CPR: CPR on Day 1 to Coffee on Day 5
- My debut year in the emergency room
- Addressing the burden of emergency departments at Kauvery Hospitals: A course on Top 10 Diagnoses in ER
- Editorial
- Guest Editorial
- Work stress and fatigue for emergency physicians in the emergency department
- Acute ischemic stroke due to Electrical Injury: A case report
- When the vessels of vessel bleed: A case of aortic intramural hematoma involving descending thoracic and abdominal aorta
- Blunt Injury Abdomen: A case report
- Unveiling the stealth threat: Cervical epidural hematoma
- Comprehensive management of methotrexate poisoning: A Case study and review
- Congenitally corrected transposition of great arteries
- Lemierre’s syndrome
- Nebulized ketamine as a treatment protocol : A case report
- Retroperitoneal hematoma following abdominal aortic aneurysm repair anti-coagulant induced case study and review
- Rupturing Reality
- Severe heat stroke with dyselectrolytemia—intravascular treatment approach
- Temporary heal can possibly kill: A case series on eucalyptus ingestion
- Wellen’s Syndrome
- Learning from Experience – Intra Operative, Chapters 31 and 32
- Kauvery CME Proceedings Special Edition: Expert Medical Learning & Clinical Insights
- IMA Meeting March 2024 proceedings
- Burns: Definition and Epidemiology
- Burns management in ER
- Fluid management and wound care in Burn Patients
- Introduction to Burns
- Sepsis management in Burns
- Surgery for Burn patients
- Nutrition care process: In Burns
- EDITORIAL
- Editorial Board of Kauvery Hospital Journal
- Rare and complex type of MS, tumefactive multiple sclerosis
- Dilemma of decoding a difficult fever
- IMAGE CHALLENGE DIAGNOSTIC IMAGE
- PATIENT’S VOICE – A BOLT FROM THE BLUE
- THE UNIQUE MIND AN ANTHOLOGY OF POEMS
- EDITORIAL
- EDITORIAL BOARD
- SARS-CoV-2 Vaccination Before Elective Surgery
- A guideline for patients with diabetes mellitus, towards self-assessment of their feet
- Evolution of Dashboards and its Effectiveness in Performance Management and Efficient Utilization of Time and Energy
- Understanding and Use of Sensitivity, Specificity, and Predictive Values
- Anorexia Nervosa with Compulsive Exercising – A Case Report
- From the Desk of the Editor-in-Chief
- Section Editor
- PATIENT’S STORY
- The Un-Relished Performance
- THE ELECTRONIC MEDICAL JOURNAL OF KAUVERY HOSPITALS
- Vascular Covid Diaries
- Encephalitis – a success story
- Intracoronary imaging
- Patient’s Voice
- THE CURE BY KAANTHAL MANIKANDAN
- SEIZURE IN A NEWBORN
- SGLT 2 inhibitors in kidney disease
- Editor’s message – Dr Venkita S Suresh
- Preparing your manuscript
- Pulmonary valve endocarditis: a case report
- Upper limb replantations at different anatomical levels: a short case series Kiran Petkar
- Re-challenging asparaginase after cerebral venous sinus thrombosis in 5-year-old with acute lymphoblastic leukemia
- Prevalence of vitamin B12, folate deficiency and homocysteine elevation in ASCVD or venous thrombosis
- HENOCH SCHOENLEIN PURPURA
- Life turns upside down for a young couple and family
- The Humblest Wonder
- Vaccine Induced Cerebro Venous Thrombosis with Thrombocytopenia (VITT) – A Case Report
- Editor-in-Chief
- EDITORIAL
- Neurobiology of Romantic Love
- An interdisciplinary approach to treatment of juvenile OCD: a case report
- Fanconi Anaemia – Need to look at the whole picture
- The Art and Science of Preparation and Publication of Medical Research from Kauvery Hospitals
- FUNDAMENTALS OF STATISTICS
- Diagnostics Images
- A WAKE-UP CALL FROM THE ANAESTHESIOLOGIST, BY DR. VASANTHI VIDYASAGARAN
- A PATIENT’S STORY
- THE FALLACIES OF PERFECTION
- EDITORIAL
- EDITORIAL BOARD
- Difficult to Treat Epilepsy: A Management Primer for Non-Neurologists
- Clinical audit: A Simplified Approachs
- Rationalise and Restrict Antibiotic Use by Utilizing A Proactive Justification Form and Comparing with Earlier Antibiotic Usage in The Same Paediatric Unit in A Tertiary Care Centre
- COVID-19 and Fungal Infection – An Opportune Time: A Case Series
- Thymidine phosphorylase (TYMP) gene stop mutation, G38X, in a familial case of mitochondrial neurogastrointestinal encephalomyopathy
- Image Challenge
- PATIENT’S STORY
- ANTHOLOGY OF POEMS
- POEM
- POEM
- EDITORIAL
- EDITORIAL BOARD
- Hypertension – a renal disease
- A New Cause for Confusion or Concern – A Case Series
- A rare case of acute aortic dissection secondary to a penetrating aortic ulcer in the ascending aorta
- Pacemaker in children – big shoes to fill for small foot
- The Eight Roles of The Medical Teacher – The Purpose and Functions of a Teacher in The Healthcare Professions by Ronald M. Harden & Pat Lilley
- Reducing the stock items – Need to look at the whole picture
- DIAGNOSTIC IMAGES
- Mountain behind a mountain
- The Disappearing Act
- EDITORIAL
- EDITORIAL BOARD
- TO CRUSH OR NOT TO CRUSH? DON’T RUSH TO CRUSH!
- Effectiveness of Pre – Clinical Competency Certification Program on Improving Knowledge of Clinical Practice Among Nursing Internship Students
- Medical Statistics in Clinical Research – Mean, Median, Standard Deviation, p-value, Chi Squared test
- Vertebral artery dissection with thrombosis causing neuralgic amyotrophy
- Atypical Electrical Alternans Due to Large Left Pleural Effusion
- Early presentation of a rare disorder
- DIAGNOSTIC IMAGES
- PATIENT’S STORY
- ANTHOLOGY OF POEMS
- EDITORIAL
- EDITORIAL BOARD
- GUEST EDITORIAL
- Clinical MIS – A Clinical Analyst Review
- Eclampsia and HELLP Syndrome: A Case Report
- Percutaneous Device Closure in A Toddler with PDA and Interrupted IVC
- Pediatric Car Passenger Trauma – A Case Report and A Review of Child Safety Inside a Car
- Use Of Antibody Cocktail, Regn-Cov2, In Two Non-Hodgkin’s Lymphoma (NHL) Patients with Mild Covid-19 Disease, At A Tertiary Care Hospital in South India: A Case Series
- Neurology Update
- Journal Scan: Heart Failure, COVID-19, Transplants, Immunology & Clinical Risk Studies
- DIAGNOSTIC IMAGES
- The Patient Is Always Right
- Humanity’s Most Cherished Fiction
- Mucormycosis in COVID-19: A Clinico-Microbiological Dilemma
- ANAEMIA OR HYDROCELE – WHICH SHOULD BE DEALT WITH FIRST
- OUR EXPERIENCE WITH COVID-19 RELATED MUCORMYCOSIS
- DVT in a child: A case to introspect
- Rainbow within a storm
- Reversal of Dabigatran in patients with intracerebral haemorrhage – a narrative review
- STEREOTACTIC BODY RADIOTHERAPY – VT TREATMENT
- TO BOOST OR NOT TO BOOST? INDIAN PERSPECTIVES – COVID VACCINATION
- EDITORIAL
- EDITORIAL BOARD
- GUEST EDITORIAL
- Convalescent Plasma Therapy in Covid-19: A Question of Timing
- High Dose methotrexate in Children with Cancer Without Drug Level Monitoring – 133 Cycles Experience
- Prenatal diagnosis in Thalassemia – Prevention is better than cure
- Improving Outcomes in Children with Cancer – Our Experience
- Autologous Stem Cell Transplantation for Myeloma with CKD
- All Megakaryocytic Macrothrombocytopenia Are Not ITP
- Telomeropathies and Our Experience: A Case Series
- Neurology Update – Neurobiology of Sleep
- Journal scan: A review of twelve recent papers of immediate clinical significance, harvested from major international journals
- The Brush Stroke
- A rare case of flood syndrome: a case report of fatal complication of umbilical hernia in liver cirrhosis
- Editorial
- Kauverian eMedical Journal
- COVID-19 and the Change in Perspective: Musings of Two Seasoned Pediatricians
- World Prematurity Day: Reflections of a Neonatologist
- Epilepsy in Kids: Problems Beyond Seizures
- Overcoming Challenges and Performing First Paediatric Allogenic Bone Marrow Transplantation in Trichy
- Vaccine Induced Cerebro Venous Thrombosis with Thrombocytopenia (VITT) – A Case Report
- DX ICD Implanted After Unmasking Brugada – A Case Study
- DNB Thesis
- Kauvery 4th Annual Nursing Conclave N4 – 2021
- Learning from Experience – 13 and 14
- The Consultation Room
- Journal Scan
- Recommended Reading
- Diagnostic Image
- From Sand to Sky
- Editorial
- Kauverian eMedical Journal
- Transfusion-related acute lung injury
- Equalizing leg length by “lengthening the shorter leg” by surgery: a case report
- VKA induced catastrophic bleeding management with Prothrombin Complex Concentrate (PCC): a practice changer
- Case Report
- Orthopaedics case series
- Morbidity and mortality meetings for improved patient care
- Significance of waist to height ratio as an early predictor in developing metabolic syndrome in children of age group 5-12 years in a tertiary care centre in Trichy: Part IV
- Chapter 15
- The Consultation Room
- Journal scan: A review of 10 recent papers of immediate clinical significance, harvested from major international journals
- Recommended Reading
- Measuring Association in Case-Control Studies
- DIAGNOSTIC IMAGE
- The Stream of Life
- Editorial
- Kauverian eMedical Journal
- Let’s prepare for the unexpected guest who always arrives at odd hours: Pre-eclampsia
- Cerebrospinal fluid-cutaneous fistula after neuraxial procedure and management: a case report
- Impella CP assisted recovery of acute COVID 19 fulminant myocarditis presenting as out of hospital cardiac arrest and cardiogenic shock
- Ischemic stroke after Russel’s Viper snake bite, an infrequent event: a case report
- Nutrition needs of preterm babies
- Chapter 17
- The Consultation Room
- Journal scan: A review of 10 recent papers of immediate clinical significance, harvested from major international journals
- Recommended Reading for Medical Professionals
- DIAGNOSTIC IMAGE
- Tick Talk
- EDITORIAL
- EDITORIAL BOARD
- Cervical collar in trauma patients – friend or foe?
- Oxygen conservation strategies
- Chronic periodontitis: a case report
- Erythema multiforme in COVID-19: a case report
- Secondary Synovial Chondromatosis of the knee Joint-a case report
- Statistical Risk Ratio (Relative Risk) Data Analysis
- Journal scan: A review of ten recent papers of immediate clinical significance, harvested from major international journals
- Splinter Haemorrhage
- Dignity matters
- Where does time fly to?
- DIAGNOSTIC IMAGE 1
- Editorial
- Editorial Board
- ABO incompatible renal transplant in a post COVID patient with COVID antibodies
- Neuromyelitis Optica early presentation of an adult disorder
- The gamut of neurological disorders associated with COVID-19
- Anaesthetic management of patients with Takayasu arteritis
- My Pains and Gains in Becoming A Doctor
- Significance testing of correlation coefficient
- Journal scan: A review of ten recent papers of immediate clinical significance, harvested from major international journals
- While you were sleeping
- Subliminal Sublimes (Sonnet 1)
- Editorial
- Instructions for Authors
- COVID-19 and mucormycosis: the dual threat
- COVID-19 associated mucormycosis: efforts and challenges
- Saccular abdominal aortic aneurysms: a case series
- Trauma and OCD – A Case of a Boy with Dark Fears
- Chapter 3
- Journal scan: A review of 10 recent papers of immediate clinical significance, harvested from major international journals
- The Consultation Room
- DIAGNOSTIC IMAGE
- A Patient’s Perception of Pulmonology
- Just a leaf
- Editorial
- Editorial Board
- Dilemma of shadows
- One-year journey in Kauvery! Challenges in Neuroanaesthesia and Neurointensive care
- Leadless pacemakers: The future of pacing?
- Clinical Therapeutics: The polymyxins, existing challenges and new opportunities
- Decision to Take Up a Patient in The Presence of Arrhythmias
- Why growing public dissatisfaction about medical profession?
- JOURNAL SCAN
- Diagnostic Image
- The cloud over a young life
- The Waiting Room
- Author Instruction
- Editorial
- Editorial Board
- The French Connection!
- Rare cause of pyrexia of unknown origin: Primary gastrointestinal non-Hodgkin’s lymphoma
- Impact of multi-disciplinary tumour board (MDT) on cancer care
- WPW pathway ablated from uncommon location
- Statistical hypothesis – using the t-test
- Learning from Experience – Chapters 6 and 7
- The Consultation Room
- Journal scan: A review of 10 recent papers of immediate clinical significance, harvested from major international journals
- Diagnostic Image
- When the sun sets over a good life
- The Deepening Dent
- Save Farmers, Save Future
- Editorial
- Editorial Board
- Guest Editorial
- Significance of waist to height ratio as an early predictor in developing metabolic syndrome in children of age group 5-12 years in a tertiary care centre in Trichy: Part I
- Journal Club
- Statistical Non Parametric Mann – Whitney U test
- Learning from Experience – Chapters 8 – 10
- The Consultation Room
- Journal scan: A review of 10 recent papers of immediate clinical significance, harvested from major international journals
- Diagnostic Image
- Valiant Velvet Paws
- Editorial
- Editorial Board
- Repurposing anti-rheumatic drugs in COVID
- An Effective Journal Club Presentation: A Guide
- A Masquerader Vasculitis as Usual: Time Is Tissue
- A Sinister Swelling: A Case Report
- DNB Thesis
- Statistical Regression Analysis
- Learning from Experience – 11 and 12
- The Consultation Room
- Journal Scan
- Diagnostic Image
- Stained not torn
- Kauverian Editorial: Interventional Nephrology, Clinical Innovations & Emergency Medicine Tribute
- Author Instruction
- Interventional Nephrology
- Amplified Ears and Listening Brains
- Love makes life worth living
- Usage of Dapagliflozin in Elderly
- Severe Methemoglobinemia Treated Successfully with Oral Ascorbic Acid: A Case Report
- The new imitator
- Liver Cyst
- Learning from Experience – Intra Operative, Chapters 17 and 18
- The Consultation Room
- Journal scan
- Recommended Readings
- Frontline ER Stories & Medical Mentorship
- Evolution of Emergency Medicine in India and the Emergence of the MEM Program at Trichy
- Welcome to the Dance floor: The Emergency Room
- Life of An Emergency Physician
- A Racing Heart Beat: To Shock or Not
- Being Calm Amidst Chaos: Tips on How to Be an Expert Emergency Nurse
- COVID COVID everywhere, but not a place to run away from!
- Proud to be an Emergency Nurse: Life in the fast lane!!!
- The Journey of a Fresher Nurse in the ED
- Ready, Steady, Go!!! A brief on Green Corridor activation in Organ Transplantation
- An Elevator Story!!!
- Veno-occlusive mesenteric ischemia: A case report
- Stridor: An Alarming Sign in Emergency
- Amnesia in the ER: That Ghajini Moment!!! A Case series
- Survival After Paraquat Ingestion: A Case Series
- When you save one life, you save a family
- Severe Methemoglobinemia, Unresponsive to Methylene Blue
- Severe Meliodosis With Multisystemic Involvement: A Case Report
- A Case Report: Diabetic Ketoacidosis Masking Acute Pancreatitis
- Recognize Rhabdomyolysis early to prevent Acute Kidney Injury and Acute Renal Failure
- New Onset Refractory Status Epilepticus (NORSE)
- Sensitive of EFAST in trauma in correlation with CT scan
- Sub Arachnoid Haemorrhage, management in Emergency and Neuro Intensive care
- Uncommon presentation of Takayasu Arteritis as a convulsive syncope
- All right sided hearts are not Dextrocardia
- COVID and the Salt Story
- Acute Lower Limb Ischemia: A Clue to Underlying Aortic Dissection
- Globe Injury with Orbital Blow Out Fracture
- The heat-stricken life – Treatment in time only saves lives!
- Pneumoperitoneum, does it have any clinical significance?
- Hypertensive Emergency in the ED
- Role of a paramedic in inter-hospital transfer
- Golden Hours in Safer Hands
- Through rough, crowded roads and stagnant waters – we race against time to reach you!
- Kauverian Editorial: COVID Pregnancy, Advanced Surgical Cases & Clinical Innovations
- Author Instruction
- Nana M, et al. Diagnosis and Management of COVID-19 in Pregnancy. BMJ 2022;377:e069739.
- MICS CABG with LIMA and Left Radial artery, harvested by Endoscopic technique: An ultrashort report
- Ultra-Short Case Report
- An interesting case of Bilateral Carotid aneurysms
- Coarctation of Aorta with Subarachnoid Hemorrhage – A Case Report
- Uterine artery embolization: Saving a mother and her motherhood
- Acute Abdomen – Sepsis – CIRCI: A Success Story
- Diagnostic Image
- Learning from Experience – Intra Operative, Chapters 19 and 20
- The Consultation Room
- Journal Scan
- Recommended Readings
- Editorial
- Kauverian eMedical Journal
- Cardiothoracic surgery in the COVID era: Revisiting the surgical algorithm
- Review
- Corona warrior award
- Case Series
- Takotsubo cardiomyopathy
- Learning from Experience – Chapters 3 and 4
- The Consultation Room – Chapters 41 to 45
- Journal scan
- Recommended Reading
- DIAGNOSTIC IMAGE
- Poem from Staff Nurse
- Editorial
- Author Instruction
- Male V. Menstruation and COVID-19 vaccination
- Efficacy and doses of Ulinastatin in treatment of Covid-19 a single centre study
- Electronic registries in health care
- Monoarticular Large Joint Rheumatoid Arthritis | A Case Report
- Anaemia in pneumonia: A case report
- Successful treatment of two cases of rare Movement Disorders
- Analysis of variance Two-Way ANOVA
- Learning from Experience – Chapters 5 and 6
- The Consultation Room
- Journal Scan
- Recommended Reading
- Diagnostic Image
- Poem from Staff Nurse
- Editorial
- Kauverian eMedical Journal
- An obituary, farewell to a very dear friend
- ‘Vitamin D’: One vitamin, many claims!
- Implantation of Leadless Pacemaker in a middle-aged patient: An ultra-short case study
- ABO-incompatible renal transplant at ease
- Basal cell adenoma parotid: A case report
- Correction of Cubitus Varus Deformity in an Adolescent – A Case Report
- Learning from Experience – Chapters 7 and 8
- The Consultation Room
- Journal Scan
- Recommended Reading
- Diagnostic Video: Left Paramedian Midbrain Infarct with Third Nerve Palsy
- Poem from Staff Nurse
- Editorial
- March – the Month for Minds to dwell on Multiple Myeloma
- Covid Report
- Research Protocol
- New Arrows in our Quiver, to direct against SARS-CoV-2 variants
- Out-of-hospital cardiac arrest
- Last on the list: A diagnosis seldom considered in males
- Giant T wave inversion associated with Stokes: Adams syndrome
- Learning from Experience – Intra Operative, Chapters 9 and 10
- The Consultation Room
- Definitions of probability
- Journal Scan
- Recommended Reading
- Diagnostic Video
- A Thanksgiving to Cardiac Surgeons
- Editorial
- Kauverian eMedical Journal
- Research Article
- Research Protocol
- Saving the unsavable
- Case Report
- Case Report
- Letters to the Editor
- Diagnostic Image
- Learning from Experience – Intra Operative, Chapters 13 and 14
- The Consultation Room
- Journal Scan
- Recommended Readings
- Kauverian Editorial on Diabetes Burnout & Emergency Medicine Cases
- Author Instruction
- SIGARAM – The Club for Children with Diabetes
- The hope for a better tomorrow
- An unusual complication of polytrauma:
- An enigma at the ER
- Dynamic examination of airway
- Journal Club
- Journal Club
- Journal Club
- Conditional Probability
- Diagnostic Image
- Learning from Experience – Intra Operative, Chapters 15 and 16
- The Consultation Room
- Journal Scan
- Recommended Readings
- EDITORIAL
- Kauverian eMedical Journal
- Junior nurses in Kauvery Hospital on the frontline against the COVID-19 pandemic
- Emergency Medicine, the Emerging Specialty: Leading Light on the entrance to the Health Care Pathway
- Battle of two drugs: Who won? – An unusual presentation
- Return of the native and a resurrected foe: A case of Rhinocerebral Mucormycosis
- Covert invader- atypical presentation of neuronal migration disorder
- Fragile heart: an unusual cause of chest pain
- Goldberger’s ECG sign in Left Ventricular Aneurysm
- Congenital absence of bilateral Internal Carotid Artery: A case report
- The Power of Purple
- Beads of Nature’s Rattle
- Case Report
- Diagnostic Image
- EDITORIAL
- Kauverian eMedical Journal
- Modification of Management Strategies, And Innovations, During SARS Cov2 Pandemic Improved the Quality, Criticality and Outcomes in In-Patients “Rising to the occasion”, the mantra for success in the COVID -19 pandemic
- Time in Range (TIR) In Diabetes: A Concept of Control of Glycemia, Whose Time Has Come
- Kauvery Heart Failure Registry- A Concept
- Shorter Course of Remdesivir In Moderate Covid-19 is as Efficacious as Compared to Standard Regime: An Observational Study
- CASE REPORT
- Lymphoepithelial Carcinoma: A Case Report of a Rare Tumour of The Vocal Cord
- Diabetic Keto Acidosis (DKA), Associated with Failed Thrombolysis with Streptokinase in Acute Myocardial Infarction
- LEARNING FROM EXPERIENCE – CHAPTERS 1 AND 2
- The Consultation Room
- Journal scan
- Recommended Reading
- DIAGNOSTIC IMAGE
- Notes to Nocturne
- Kauverian Editorial on Adult Congenital Heart Disease & Diabetes Research
- Kauverian eMedical Journal
- Caring for nobody’s baby
- Special Report
- Research Article
- The curious case of a migrating needle on the chest wall
- Foreign body: A boon at times
- Cardiorenal Syndrome
- What My Grandmother Knew About Dying
- Endovascular Therapy for Acute Stroke with a Large Ischemic Region. N Engl J Med. 2022
- Letter to the Editor
- Clinical outcomes of Coronary Artery Disease in Octogenarians
- Diagnostic Image
- Learning from Experience – Intra Operative, Chapters 11 and 12
- The Consultation Room
- Journal Scan
- Recommended Reading
- colours
- Kauverian Editorial on Cardiac Transplant & Clinical Research Insights
- Author Instruction
- Ultrashort Case Report
- Cochlear Implantation: Expanding candidacy and Cost Effectiveness
- Spontaneous Pneumomediastinum in COVID 19 – Tertiary Care Centre Experience in South India
- Amoxycillin Induced Anaphylactic Shock: A Case Report
- An Unusual Cause of Seizures: A Case Report
- Case Report
- Educational Strategies to Promote Clinical Diagnostic Reasoning
- Rheumatic Rarities
- Types of sampling methods in statistics
- Diagnostic Image
- Learning from Experience – Intra Operative, Chapters 21 and 22
- The Consultation Room
- Journal Scan
- Recommended Readings
- Editorial
- Author Instruction
- Journal Scan
- Myeloma
- Posterior Reversible Encephalopathy Syndrome (PRES)
- Prophylactic orthopaedic surgery
- Subclavian steal: An interesting imaging scenario
- Spondylo-epi-metaphyseal dysplasia (SEMD)
- The bleeding windpipe
- Learning from Experience – Intra Operative, Chapters 23 and 24
- The Consultation Room
- Diagnostic Image
- Recommended Readings
- Kauverian Editorial on Adult Vaccination & Advanced Clinical Case Reports
- Editorial Board
- Physician, Protect thyself
- Foetal Medicine, the Future is here!
- Japanese Encephalitis: A common menace
- Carpometacarpal dislocation with impending compartment syndrome
- Heterotopic pregnancy
- Femoral Trochantric and Proximal Humerus Fracture, from Diagnosis to Rehabilitation
- My Father’s Heart Block
- EPS page
- CRT CSP Cases
- Journal scan
- Learning from Experience – Intra Operative, Chapters 25 and 26
- The Consultation Room
- Recommended Readings
- Kauverian Editorial on Multiple Sclerosis & Advanced Clinical Care
- Editorial Board
- Multiple Sclerosis: An overview
- A flower born to blush unseen
- Guest Editorial
- Radio-frequency ablation as an effective treatment strategy in a case of VT storm post STEMI
- Lymphatic malformation of tongue
- Bilateral anterior shoulder dislocation in epilepsy: A case report and review of literature
- An unusual cause of Stridor
- Monoclonal Antibodies (mAbs) – the magic bullets: A review of therapeutic applications and its future perspectives
- Write the Talk
- Press release and Comments
- Probability Distribution of Bernoulli Trials
- Journal Scan
- Recommended Readings
- poem-v4i4
- Kauverian Editorial on COVID-19 Research & Trauma Care Insights
- Editorial Board
- Research
- Research
- Lambda-cyhalothrin and pyrethrin poisoning: A case report
- Good Enough
- The Monoclonal antibodies (mAbs): the beginning
- Comprehensive trauma course 2022: Trauma Management & Kauvery
- Comprehensive trauma course 2022: Introduction to Comprehensive trauma course
- Diagnostic Image
- Learning from Experience – Intra Operative, Chapters 27 and 28
- The Consultation Room
- Recommended Readings
- Poem
- Editorial
- The Brave New World of Anaesthesia
- Anesthetic considerations in Wilson’s disease for fess: A case report
- The painful story behind modern anaesthesia
- Anesthesia considerations for Ankyslosing Spondylitis
- Total intravenous anaesthesia: An overview
- Risk stratification for cardiac patients coming for non-cardiac surgeries
- The Anaesthesiologist’s role in fluoroscopic guided epidural steroid injections for low back pain
- Awake Craniotomy
- Malpositioned central venous catheter: Step wise approach to avoid, identify and manage
- Benefits outweighing risk: Neuraxial anaesthesia in a patient with Spina Bifida with operated Meningomyelocele
- Pain free CABG: newer horizon of minimally invasive cardiothoracic surgery a walk through anaesthesiologist perspective
- Stellate Ganglion Block: A bridge to cervical sympathectomy in refractory Long QT Syndrome
- Venous Malformation in Upper Airway – Anesthetic Challenges and Management: A Case Report
- Kauverian Editorial on Anaesthesiology & Advanced Airway Management
- USG guided peripheral nerve block in surgery for hernia
- Anaesthesia and morbid obesity: A systematic review
- Patient-Controlled Analgesia
- Parapharyngeal abscess of face and neck: Anesthetic management
- 3D TEE, a boon for the diagnosis of Left Atrial Appendage thrombus!
- Anaesthetic management of difficult airway due to retropharyngeal abscess and cervical spondylosis
- Expect the unexpected – Breach in continuous nerve block catheter
- Lignocaine nasal spray: An easy remedy for Post Dural Puncture Headache
- Potassium permanganate poisoning and airway oedema
- Angioedema following anti-snake venom administration
- Kauverian Editorial on EPS Research & Advanced Clinical Care
- Editorial Board
- Ra Fx ablation of Atrioventricular nodal reciprocating tachycardia
- Pace and Ablate Strategy: Conduction system pacing with AV junction ablation for drug refractory atrial arrhythmia – A novel approach
- Why Cardiac Resynchronization Therapy (CRT) For complete heart block? A case discussion
- Pacemakers and Bradyarrhythmias in Diabetic Mellitus
- Outcomes of Total Knee Arthroplasty in patients aged 70 years and above
- An approach to CBC for practitioners
- Acute cerebral sinus venous thrombosis with different presentations and different outcomes: A case series
- Diet and nutritional care for DDLT: A case study
- Vaccine for Dengue (Dengvaxia CYD-TDV)
- Diagnostic Image
- Learning from Experience – Intra Operative, Chapters 31 and 32
- Recommended Readings
- காவிரித்தாய்
- ATLAS OF HAEMATOLOGY AND HEMATOONCOLOGY
- Kauverian Editorial on XDR TB & Advanced Clinical Research
- Editorial Board
- Case reports and Case series:
- Usefulness of NEWS 2 score in monitoring patients with cytokine storm of COVID-19 pneumonia
- Treatment approach for extensively Drug-Resistant Tuberculosis (XDR-TB)
- Modified Lichtenstein mesh repair, for a patient of Coronary Artery Disease, Heart Failure and with Implanted Cardioverter- Defibrillator
- Fever-induced Brugada Syndrome
- Pulmonary Thrombo Embolism: When to Thrombolyse?
- Ultra-Short Case Report
- Learning from the failure of Nebacumab
- Journal scan
- Learning From Experience Intra Operative Chapters 29 and 30
- Recommended Readings
- Poem
- Editorial: Advancing Clinical Learning Through Innovation, Research and Patient Care
- Editorial Board
- Heart transplantation: Life beyond the end of life
- Azithromycin to Prevent Sepsis or Death in Women Planning a Vaginal
- Medial retropharyngeal nodal region sparing radiotherapy versus standard radiotherapy
- Proximie: Patient safety in surgery – the urgent need for reform
- Analysis of femoral neck fracture in octogenarians and its management
- Adult Immunisation in Clinical Practice: A Neglected Life Saver
- “Icing” The Eyes
- Doppler vascular mapping in Arterio Venous Fistula (AVF)
- Cosmesis and cure: Radiotherapy in basal cell carcinoma of the dorsum of nose – A case report
- Pulmonary Hypertension and Portal Hypertension
- Comprehensive review of Drug-Induced Cardiotoxicity
- Statistics – Data Collection – Case Study Method
- Atlas of Haematology and Hematooncology
- PRE-OPERATIVE Chapters 1 and 2 – Learning from Experience
- Chapter 2. Uncertainties in medicine in spite of advances
- No Splendid Child
- Editorial: Advancing Multidisciplinary Healthcare Through Research and Innovation
- Editorial Board
- A Young Girl Lost in the Storm
- ECMO as a bridge to Transplant: A case report
- Renal anemia – from bench to bedside
- Mission Possible
- New kids on the block – Update on diabetic nephropathy therapy
- Infections – Trade off in Transplants
- To Give Or Not to Give – Primer on Bicarbonate Therapy
- Sialendoscopy: Shifting paradigms in treatment of salivary gland disease
- Gait imbalance in a senior due to Chronic Immune Sensory Polyneuropathy (CISP)
- Statistics – Mcnemar Test
- Atlas Of Haematology And Hematooncology
- PRE-OPERATIVE Chapters 3 and 4 – Learning from Experience
- Changing trends a challenge to the already trained
- Journal scan
- Recommended Readings
- EDITORIAL
- EDITORIAL BOARD
- PREGNANCY POST-RENAL TRANSPLANT
- BALLOON-OCCLUDED RETROGRADE TRANSVENOUS OBLITERATION
- REVERSE SHOULDER ARTHROPLASTY FOR ROTATOR CUFF ARTHROPATHY
- THE AMBUSH A TEAM APPROACH
- ENDOSCOPIC TRANS-SPHENOID APPROACH FOR PITUITARY ADENOMA EXCISION
- A STUDY ON PRESENTATION AND OUTCOME OF BULL GORE INJURIES IN A GROUP OF TERTIARY CARE HOSPITALS
- A CASE OF INTERNUCLEAR OPHTHALMOPARESIS AS THE FIRST MANIFESTATION OF MULTIPLE SCLEROSIS
- GRANULOMATOSIS WITH POLYANGITIS AND LUNG INVOLVMENT (WEGENER’S DISEASE)
- RITUXIMAB (RITUXAN, MABTHERA) IN THE TREATMENT OF B-CELL NON-HODGKIN’S LYMPHOMA
- STATISTICAL SIGNIFICANCE
- Atlas Of Haematology And Hematooncology
- PRE-OPERATIVE CHAPTERS 5 AND 6 – LEARNING FROM EXPERIENCE
- Chapter 4: Diagnostic process often reversed
- Journal scan: A review of 25 recent papers of immediate clinical significance, harvested from major international journals
- Recommended Readings
- ஆரோக்கியம் நம் கையில்
- வெற்றியின் பாதை
- Kauverian Editorial on AI in Healthcare & Clinical Research Advances
- Editorial Board
- Prevalence of vitamin D deficiency in a multi-speciality hospital orthopaedic outpatient clinic
- Esomeprazole induced Hypoglycemia
- Dynamic external fixator for unstable intra articular fractures of Proximal Interphalangeal Joint (PIP): “Suzuki” frame
- How to Practice Academic Medicine and Publish from Developing Countries? A Practical Guide, Springer Nature, 2022
- WINTNCON 2022 – Scientific Program
- Pulmonary Thrombo Embolism: A state of the art review
- Role of Artificial Intelligence in improving EHR/EMR and Medical Coding and billing
- Monoclonal Antibodies: Edrecolomab and Abciximab
- Atlas of haematology and hematooncology
- Journal scan
- Learning from Experience – Intra Operative, Chapters 31 and 32
- What doctors must learn: Doctor, look beyond science
- Recommended Readings
- I Whisper Secrets In My Ear
- Editorial: Showcasing Clinical Excellence, Research and Healthcare Innovation
- Instructions for Authors
- Mismatched Haploidentical Bone Marrow Transplantation in a 10-year-old boy with relapsed refractory acute lymphoblastic leukemia, at Trichy
- ST-Segment Elevation is not always Myocardial Infarction
- Acyanotic Congenital Heart Disease, repaired, evolves into a Cyanotic Congenital Heart Disease and presents with an atrial tachycardia
- Family medicine – caring for you for the whole of your life. A Lost and Found Art
- The Principles and Practice of Family Medicine
- Complete Heart Block
- Sick Sinus Syndrome (SSS)
- The First Ever National Award Comes to Kauvery Hospital Chennai & Heart City for Safety and Workforce Category in IMC RBNQA Milestone Merits Recognition 2022
- Diagnostic Image
- PRE-OPERATIVE CHAPTERS 7 AND 7 – LEARNING FROM EXPERIENCE
- Chapter 5: Super-specialist – boon or bane
- Journal scan: A review of 42 recent papers of immediate clinical significance, harvested from major international journals
- RECOMMENDED READINGS
- நேரம் ஒதுக்கு
- மருத்துவரின் மகத்துவம்
- Editorial: Advancing Clinical Innovation Through Research and Patient Care
- Instructions for Authors
- Surgical Management of Covid-19 Associated Rhino-Orbito-Cerebral-Mucormycosis (Ca-Rocm) – A Single Centre Experience
- Knee Joint Preservation Surgeries
- Guest Editorial Comments
- Ventricular Septal (VSR) closure with ASD device
- Newer Calcium Debulking Angioplasty technique of Orbital Atherectomy
- An hour-long CPR to restart the heart
- VT or SVT with aberrancy?
- Pituitary Neuroendocrine Tumor (PitNET)
- VSD Device Closure
- PDA Device Closure
- Iron Deficiency Anemia, Post MVR
- Torsades de Pointes
- Quality improvement project to Reducing the Malnutrition Rate of ICU patients from 43% to 20%
- Long term use of Amiodarone in Cardiac patients: A Clinical Audit
- Statistical Independent Events and Probability
- PERI-OPERATIVE Chapters 9 and 10 – Learning from Experience
- Journal scan: A review of 40 recent papers of immediate clinical significance, harvested from major international journals
- Editorial: Celebrating Robotic Innovation and Clinical Research Excellence
- Kauverian Medical Journal
- First da Vinci Robotic Surgery in Carcinoma Prostate: A Case Report
- Black burden or Taylor the saviour: A case report
- Analysis of differences in Oncology practice between the United Kingdom and India
- A Case of Takayasu Arteritis
- Idiopathic Dilated Pulmonary Artery (IDPA)
- ECG Atlas
- Unusual cause of Dysphagia: A case report
- Tu Youyou: The scientist who discovered artemisinin
- Continuing Nursing Education (CNE) on Risk assessment tools, to assess vulnerable patients at Kauvery Hospital, Tennur
- DIAGNOSTIC IMAGE
- PRE-OPERATIVE CHAPTERS 11 AND 12 – LEARNING FROM EXPERIENCE
- OLD AND NEW – MAKE THE BEST OF THE TWO
- Journal scan: A review of 30 recent papers of immediate clinical significance, harvested from major international journals
- Recommended Readings
- Editorial: Celebrating Clinical Milestones and Research Excellence Across Kauvery Hospitals
- INSTRUCTION TO AUTHORS
- A pregnant patient with DKA, septic shock and a lactate mystery
- Radical Thymectomy in Myasthenia Gravis through Partial Sternotomy approach: A report on three patients
- In-utero blood transfusion in two etiologically distinct anaemic fetus
- RARE CAUSE OF PULMONARY HYPERTENSION
- Acute Rheumatic fever is still an enigma
- A remarkable journey: Managing LQTS in a 43-year-old female with recurrent syncope and seizure
- An unusual case of Acute Coronary Syndrome
- Reversible cause of severe LV Dysfunction in Left Bundle Branch Block
- A case study on Rhino-Orbital-Cerebro- Mucormycosis
- Snakebite and its management
- Total Elbow arthroplasty in Post Traumatic arthritis
- Wellens Syndrome: An ECG finding not to miss!
- Dr. C.R. Rao Wins Top Statistics Award a look back at his pioneering work
- PRE-OPERATIVE Chapters 13 and 14 – Learning from Experience
- Chapter 7. Doctor-patient relationship
- Journal scan: A review of 30 recent papers of immediate clinical significance, harvested from major international journals
- EDITORIAL
- INSTRUCTION TO AUTHORS
- FROZEN ELEPHANT TRUNK (FET) PROCEDURE IN A 52 YEARS OLD CHRONIC AORTIC DISSECTION PATIENT
- DIAGNOSING AND MANAGING EISENMENGER SYNDROME IN A YOUNG MALE
- STEMI EQUIVALENT BUT STEMI!
- TEMPORARY HEAL CAN POSSIBLY KILL!
- UNDERSTANDING PUBERTY
- THE IMPORTANCE OF STATISTICS IN HEALTHCARE
- JOURNAL SCAN: A REVIEW OF 44 RECENT PAPERS OF IMMEDIATE CLINICAL SIGNIFICANCE, HARVESTED FROM MAJOR INTERNATIONAL JOURNALS
- DIAGNOSTIC IMAGE
- PRE-OPERATIVE CHAPTERS 15 AND 16 – LEARNING FROM EXPERIENCE
- CHAPTER 8. DOCTOR-DOCTOR RELATIONSHIP
- Kauverian Special Issue on Clinical Audits & Patient Care Excellence
- GUEST EDITORIAL
- CLINICAL AUDIT: AN INTRODUCTION
- YOUNG ACS AUDIT
- CLINICAL AUDIT: ANAESTHESIA
- CLINICAL OUTCOME IN ICU PATIENTS
- RATE OF MALIGNANCY IN INDETERMINATE OVARIAN CYST – A PROCESS AUDIT
- PATTERNS OF NEEDLE DISPOSAL AMONG INSULIN USING PATIENTS WITH DIABETES MELLITUS: AN AUDIT
- CONTINUOUS PATIENT MONITORING – LIFE SIGNS
- AGE IS JUST A NUMBER!
- SVT WITH LEFT BUNDLE BRANCH BLOCK FOLLOWING GASTRECTOMY
- COMPLEX AORTIC DISSECTION WITH MULTIFACETED CLINICAL PRESENTATIONS
- From Clinical Audits to Innovation: The Editorial Perspective
- POST-OPERATIVE SORE THROAT IN GA: A CONCERN
- NEONATAL HLH: OUR EXPERIENCE
- CLINICAL REVIEW MEET 16TH NOV 2023: CHALLENGES IN SETTING UP A NEW HSCT CENTRE IN A TIER-2 CITY IN INDIA
- CARDIAC BIOMARKERS: CLINICAL UTILITY
- HIRAYAMA DISEASE: A CLINICAL-RADIOLOGICAL REVIEW
- ECG AS A WINDOW OF OPPORTUNITY: FOR HYPERKALEMIA
- ELTROMBOPAG, A NOVEL THROMBOPOIETIN (TPO) RECEPTOR AGONIST: AN OVERVIEW
- HENOCH-SCHONLEIN PURPURA
- SUBMANDIBULAR GLAND SIALADENITIS SECONDARY TO SUBMANDIBULAR CALCULUS
- LEAN HOSPITALS
- STATISTICS BLACK-SCHOLES MODEL
- PERI-OPERATIVE CHAPTERS 17 AND 18 – LEARNING FROM EXPERIENCE
- CHAPTER 9. BUILDING BLOCKS OF PATIENT CARE
- JOURNAL SCAN: A REVIEW OF 30 RECENT PAPERS OF IMMEDIATE CLINICAL SIGNIFICANCE, HARVESTED FROM MAJOR INTERNATIONAL JOURNALS
- Editorial: Celebrating Research Excellence and Clinical Innovation at Kauvery Hospitals
- INSTRUCTIONS TO AUTHORS
- ROTATHON-SERIES OF SUCCESSFUL ROTA CASES LAST 2 MONTHS: AN AUDIT
- OUTCOMES OF AKI AUDIT IN KAUVERY
- ETIOLOGY, CLINICAL CHARACTERISTICS AND OUTCOMES OF PATIENTS WITH ACUTE PANCREATITIS IN KAUVERY CANTONMENT HOSPITAL (KCN), TRICHY
- USE OF BLOOD PRODUCTS AND STEROIDS IN THE MANAGEMENT OF DENGUE AT KAUVERY TRICHY HOSPITALS: A CLINICAL AUDIT
- A CLINICAL AUDIT: ON THE MANAGEMENT OF ECTOPIC PREGNANCY
- DIABETIC KETOACIDOSIS WITH HIGH ANION GAP METABOLIC ACIDOSIS
- HYPOKALEMIC PARALYSIS FROM DISTAL RENAL TUBULAR ACIDOSIS (TYPE-1)
- DELAYED PRESENTATION OF INTERMEDIATE SYNDROME IN A PATIENT WITH ORGANOPHOSPHORUS POISONING: A CASE REPORT
- SCAPULA FRACTURES: DO WE NEED TO FIX THEM?
- SPONTANEOUS CSF RHINORRHEA
- DANCING WITH DIABETES: AN UNUSUAL CASE OF CHOREA HYPERGLYCEMIA BASAL GANGLIA SYNDROME
- CONVALESCENT RASH OF DENGUE
- ECG ATLAS 2
- MI MIMICKER
- PERFORATION PERITONITIS-A CASE REPORT
- APPLICATION OF EVIDENCE BASED PRACTICE CARE FOR INDIVIDUALS WITH SPINAL CORD INJURY WITH FUNCTIONAL DIFFICULTIES: ROLE OF THE OCCUPATIONAL THERAPY PRACTICE GUIDELINES
- METHOTREXATE INDUCED MUCOSITIS AND PANCYTOPENIA: A CONSEQUENCE OF MEDICATION ERROR IN A PSORIASIS PATIENT
- POST OPERATIVE CHAPTERS 1 AND 2 – LEARNING FROM EXPERIENCE
- CHAPTER 10. NURTURING SELF
- விடாமுயற்சி வெற்றி தரும்
- JOURNAL SCAN: A REVIEW OF 26 RECENT PAPERS OF IMMEDIATE CLINICAL SIGNIFICANCE, HARVESTED FROM MAJOR INTERNATIONAL JOURNALS
- Editorial: Advancing Clinical Research, Innovation and Patient-Centered Care
- EDITORIAL BOARD
- LIMB SALVAGE IN EXTREMITY VASCULAR TRAUMA: OUR EXPERIENCE
- MANAGEMENT OF URETHRAL CATHETER RELATED PAIN IN RENAL TRANSPLANT RECIPIENTS: A CLINICAL AUDIT
- NO PAIN VEIN GAIN WITH PRILOX IN PAEDIATRIC POPULATION
- GUIDELINE-DIRECTED MEDICAL TREATMENT (GDMT) OF HEART FAILURE AT KAUVERY HOSPITALS: A CLINICAL AUDIT
- PATIENTS STORY: DIGNITY MATTERS
- PATIENTS STORY: DIGNITY MATTERS
- VIDEO PRESENTATION- CT CORONARY ANGIOGRAPHY
- DRUG INDUCED HYPERKALEMIA
- ADULT NEPHROTIC SYNDROME
- EXPLORING COMPLEX CARDIAC CASES: INSIGHTS FROM DIVERSE PRESENTATIONS IN MID-AGED WOMEN
- CARDIOMYOPATHY AND ITS ECHO FINDINGS
- THE STRESS TEST ON THE TREADMILL
- POST OPERATIVE CHAPTERS 3 AND 4 – LEARNING FROM EXPERIENCE
- CHAPTER 11. BALANCE IN LIFE BEYOND BANK BALANCES
- JOURNAL SCAN: A REVIEW OF 30 RECENT PAPERS OF IMMEDIATE CLINICAL SIGNIFICANCE, HARVESTED FROM MAJOR INTERNATIONAL JOURNALS
- காணும் பொங்கலும் மனித மன மாற்றமும்
- Editorial: Advancing Clinical Learning Through Audits, Reviews and Research
- INSTRUCTIONS TO AUTHORS
- PREVALENCE OF STREPTOCOCCUS PNEUMONIAE SEROTYPES IN AND AROUND TRICHY AND ITS CLINICAL RELEVANCE
- ANAESTHETIC MANAGEMENT OF A PATIENT WITH HUGE GOITER: A CASE REPORT
- EUGLYCEMIC DIABETIC KETOACIDOSIS A RARE CAUSE FOR DELAYED EXTUBATION
- SUCCESSFUL PREGNANCY IN ASD PATIENT – COMPLICATED BY SEVERE PULMONARY ARTERIAL HYPERTENSION
- ENDOCRINE COMPLICATION OF GROWTH HORMONE SECRETING TUMOR: A CASE REPORT
- EFFICACY OF EARLY DIAGNOSIS AND DEVELOPMENT APPROACHES OF PAEDIATRIC OCCUPATIONAL THERAPY ON ACUTE DISSEMINATED ENCEPHALOMYELITIS: A CASE REPORT
- POST OPERATIVE CHAPTERS 5 AND 6 – LEARNING FROM EXPERIENCE
- CHAPTER 12. MILES TO GO – BEFORE TEACHING BECOMES LEARNING
- JOURNAL SCAN: A REVIEW OF 26 RECENT PAPERS OF IMMEDIATE CLINICAL SIGNIFICANCE, HARVESTED FROM MAJOR INTERNATIONAL JOURNALS
- காவேரி – 25
- POEM – மண்ணில் பிறந்தது சாதிப்பதற்குத்தான்
- Editorial
- Video – Left main disease: Is it still a Surgeons Domain
- Propofol and the unspoken pain
- Thrombocytopenia in pregnancy: Experience from a tertiary care centre of a tier 2 city in South India
- Snake envenomation and its managements
- Essentials of Advanced Cardiac Life Support
- Video – Sepsis Management
- The phantom Block: Ogilvie’s
- Airway Management in an Adult with Subglottic Stenosis: Overcoming Ventilation Challenges with a Small Endotracheal Tube ”
- Descending thoraco-abdominal aortic aneurysm rupture with left massive hemothorax –diagnosis and emergency management
- C-IIH (Chronic IIH Imaging in Headache) study: Hospital-based pictorial review of Chronic IIH variants Neuroradiologist’s perspective
- Diagnostic Image: Small bowel diverticulosis
- Occupational therapy interventions for Schizophrenia: A systematic review
- Post-Operative Chapters 23-25
- Chapter 21. How to communicate need for further tests or referral for second opinion?
- Journal scan: Journal scan: A review of 13 recent papers of immediate clinical significance, harvested from major international journals
- Poem- கருணையின் வடிவமே தானம்
- Poem – நீ உன்னையறிந்தால்
- Editorial: Celebrating Clinical Excellence, Innovation and Lifelong Learning
- Liver biopsy in children: A single centre tertiary care experience
- A prescription audit for medication safety in a tertiary care centre of Tamilnadu, India
- An update on critical care nutrition
- Geriatric pharmacotherapy and polypharmacy
- Neurofibromatosis with Autoimmune hemolytic anemia: Bystander or intriguer
- Video Presentation – ABC of CBC
- Procedure Video: A Complex Left Main Coronary Artery occlusion successfully rescued by Bifurcation angioplasty
- Neurogenic Dysphagia in Subdural Hematoma: A case report
- Diagnostic Image: Pellets in the abdominal cavity, found on Laparotomy
- Diagnostic Images: Hydatid cyst in the lung
- CME Proceedings: Cutting edge in lab medicine
- Journal scan: A review of images in clinical medicine of immediate clinical significance, harvested from major international journals
- Chapter 22. How to respond to inappropriate patient requests?
- முதுமையும் ஆரோக்கியமும்
- Editorial: Showcasing Clinical Innovation and Multispecialty Research Excellence
- Recurrent or persistent pneumonia: A case series with discussion
- Video – Clinical Utility of Adenosine in Cardiac Arrhythmias
- Human MetaPneumoVirus ( HMPV) Management of severe pneumonia, with respiratory failure
- Case Report: The medical implications of a bicuspid aortic valve discovered serendipitously in a young man
- Abducens nerve palsy in a young adult after COVID-19 infection
- Seizure-induced Takotsubo cardiomyopathy mimicking STEMI: A case report
- Electrocution: A comprehensive review
- Case report: Surgical management of a colloid cyst
- A successful abdominal aortic stenting
- Ultra short Case report and video: CPB (EUS guided celiac plexus block for chronic calcific pancreatitis)
- Diagnostic Images: Total occlusion of left cervical ICA
- Diagnostic Images: Osteoid osteoma
- Diagnostic Images: Cytology smear for mucinous carcinoma Stomach
- Journal scan: A review of images in clinical medicine of immediate clinical significance, harvested from major international journals
- Chapter 23. How to communicate risks involved in management?
- மக்களின் நம்பிக்கைக்கு மாகாவேரி
- Kauverian Editorial: Clinical Audits, Medical Research & Patient Care Innovations
- EDITORIAL BOARD
- Audit Appraisal: An overview
- Intra Ventricular antibiotics: Our experience
- Transfusion Reactions: A clinical audit
- Postoperative pain management
- Rising concerns of Carbapenem resistant Enterobacteriaceae and the options available: An overview
- Ultrashort case report on VF storm in immediate Post CABG Period—‘Angry Purkinje Syndrome’
- Lynch syndrome, diagnostic challenges and management: A case report
- Bilateral posterior shoulder fracture – dislocation due to seizure, an uncommon injury: A case report
- Navigating amlodipine overdose: A multi-disciplinary approach in a 23 year old female
- Exploring the interplay between sleep patterns and behavioural characteristics in individuals with Autism Spectrum Disorder (ASD)
- POST OPERATIVE Chapters 7 and 8 – Learning from Experience
- Chapter 13. Art of communication and counselling
- Journal scan: A review of 20 recent papers of immediate clinical significance, harvested from major international journals
- மருத்துவமனையின் தேவதையே
- மருத்துவ சிந்தனை விருந்து
- Kauverian Editorial: Cardiac Care, Clinical Audits & Medical Case Studies
- Instructions for Authors
- Cardiac surgery in an octogenarian Indian population
- Mycotic Aortoiliac Aneurysm: A case series
- The Scorpion Block—A Sting operation
- Arterial Thoracic Outlet Syndrome: A case report
- Infective endocarditis in adult congenital heart disease: A case report
- Takotsubo cardiomyopathy: A case report
- Cerebral Venous Thrombosis (CVT): A case report
- Hemophagocytic Lymphohistiocytosis in Dengue
- A prospective observational study on the prescription of Guideline Directed Medical Treatment (GDMT) for Heart Failure at Kauvery Heart City
- Guideline-Directed Medical Treatment (GDMT) of Heart Failure at Kauvery Hospitals: A clinical audit
- POST OPERATIVE Chapters 9 and 10 – Learning from Experience
- Chapter 14. How to keep updated in busy medical practice?
- Journal scan: A review of 15 recent papers of immediate clinical significance, harvested from major international journals
- சிந்தனையே சிறப்பு
- தோல்வியே வெற்றியின் பாதை
- Kauverian Editorial: Clinical Audits, Stroke Care and Healthcare Innovation
- Results of Mechanical Thrombectomy in acute stroke: A case study in a Tier 2 city in India
- A clinical audit—cost effective way of managing superficial chest wound infections post sternotomy
- Dental implants: Our experience and expertise
- A non-randomized retrospective study on the management of pediatric septic arthritis
- Analysis of femoral neck fracture in octogenarians and its management
- Airway management of a huge thyroid: A case report
- Cardiac Arrhythmias in the ER setting
- Corporate citizenship in healthcare: Nurturing social responsibility
- Guillain-Barré syndrome: A case report
- POST OPERATIVE Chapters 11 and 12 – Learning from Experience
- Chapter 15. How to be rational in practice?
- Journal scan: Elsevier’s Medicine, Current Issue, Volume 52 Issue 6, June 2024, Seminar on Poisoning
- Recommended Readings
- இயற்கை சொல்லும் செய்தி
- Editorial
- Instructions for Authors
- A rare organism causing septic arthritis of hip joint
- ICD implant in 6 year old with Jervell and Lange-Nielsen (JLN) syndrome
- A clinical audit on Bariatric/Metabolic surgery
- Clinical audit on Nil per Oral (NPO)
- A non-randomized clinical study on heat stroke
- Stress cardiomyopathy with posterior reversible encephalopathy syndrome in Eclampsia
- Intro-Reversible Cerebral Vasoconstriction Syndrome (RCVS): An ultra-short case report
- A 2 am Tamponade: Critical call to action
- Immune Checkpoint Inhibitors, and in combination with JAK inhibitors: The modelling for the future
- Optimizing the patient journey in hypertrophic cardiomyopathy—Patient and clinician perspectives: Summary of CME from Medscape
- ER Intervention
- Diagnostic Images/Videos
- A randomized controlled trial: Different types of blinding
- Journal scan – June
- Journal scan – July
- Post-Operative Chapters 13, 14
- Chapter 16. How to enjoy medical practice?
- Driving business growth with 5S and lean strategies: A transformative session for corporations in the Trichy region
- Poem: 25 – வருடங்களாக காவேரி
- Editorial
- A Data Audit: Tool for Good Clinical Practice
- Ortho rehab audit at Kauvery Hospital, Trichy
- Endovascular Thrombectomy in young patient with a stroke – surgical procedure decompressive craniotomy
- Secondary HLH (Hemophagocytic Lymphohistiocytosis): An ultra-short case report
- Prone ventilation: A case series
- Dermatologic Emergencies: A case series
- Managing DKA at the ER
- Podcast – Managing DKA at the ER
- Insertion of tunneled hemodialysis catheter through the collateral vein adjacent to the thrombosed right jugular vein.
- Access failure with dysfunctional tunnelled haemodialysis catheter in the presence of exit-site infection
- Video – A multidisciplinary approach to preventing sudden cardiac death
- Dasatinib in pediatric Chronic Myeloid Leukemia: An overview
- Dyslipidemia management: Indian perspective
- Pharmacological stress testing: Assessing heart health without exercise
- Journal scan: A review of 15 Ethics with clinical significance, harvested from a major international journal
- Post-Operative Chapters 15 and 16
- Chapter 17. How to find time for the family
- Poem – உனக்காக நீ
- Editorial
- An audit: A silent disease-Osteoporosis
- An approach to antibiotic therapy: A primer for all specialties
- Audit on pediatric Cholesteatoma
- Clinical audit: ER to ICU transit time
- A case report on Multiple myeloma: Value of pre and post-treatment MRI
- Unrelated donor bone marrow transplantation in 3 year old with Acute Myeloid Leukemia
- Infective endocarditis: A case series
- A Retrospective observational study on Scrub typhus paediatric population in Kauvery Hospitals, Trichy
- Clinical Pharmacy Approach: To a patient on multiple anticonvulsants for “Difficult to control’’ seizure disorder
- An analysis of the Urea to Creatinine Ratio (UCR) in different cardiac surgeries
- Journal scan – 1
- Journal Scan – 2
- Post-Operative Chapters 17 and 18
- Chapter 18. How to be legally safe in medical practice?
- Poem – காவேரியின் மாரத்தான்
- Poem – ஆரோக்கியம் என்னுடையது
- Editorial
- Clinical audit on antibiogram
- Renal transplantation in marrow dysfunction: A case series
- Empowering lifesavers: Impact of BLS and PALS training for PICU and critical care nurses
- Myotonia congenita: A case series
- Utilization of Inj. Sovateltide: A novel injectable formulation
- Retroperitoneal sarcoma: A report of two cases
- Traumatic simultaneous bilateral femur and tibia shaft fracture in an 8-year-old male child: An unusual case report
- Echocardiography in the assessment of shock
- Plasma combats angioedema: A case report
- A case report and video presentation on a 9-year-old boy who underwent PAPVC
- Interventional Radiology: Large gastric varices
- Interventional Radiology: A case of active PV bleeding post-D and C day 12
- Diagnostic Images: Exencephaly
- A short case report on Hyperdontia (extra teeth)
- Post-Operative Chapters 19 and 20
- Chapter 19. How to deal with incurable disease?
- CII CFO Excellence award: A recognition of exceptional leadership
- Journal scan
- Poem – மறுக்காதே மறவாதே
- Editorial
- An audit: Microvascular Free Flaps
- DSME Programs – Lessons learned
- Surgical Reconstruction Of Acromio Clavicular Joint Dislocation Using Double Endobutton – A Case Report
- Complex Iliac Artery And Venous Reconstruction In Case Of Polytrauma – Case Report
- Basics of statistics- from of a clinician’s perspective
- A comprehensive review on Rabies: Clinical aspects and treatment
- Lateral Medullary Syndrome – Case Report
- Postpartum ischemic stroke – case report
- Proning Saves Lives
- Video – A challenging case of Recurrent craniopharyngioma with supra and infra tentorial cyst and hydrocephalus
- Event: Update on Atrial Fibrillation
- Investigating the Role of Activity-Based Configurational Developmental approach in Managing Mitochondrial Leukodystrophy in Children
- Post-Operative Chapters 21 and 22
- Chapter 20. How to deal with failure of treatment
- Journal scan: A review of 12 recent papers of immediate clinical significance, harvested from major international journals
- Poem – தன்னம்பிக்கையும் விடாமுயற்சியும்
- Extraordinary Edition of the Kauverian
- Kauverian Editorial: Kidney Transplant Success, Heart Failure Care & Clinical Excellence
- Renal Transplant and outcomes at Kauvery Hospitals, Trichy
- Infection control practices in operation theatre: A review
- Clinical and endoscopic profile of GI bleed patients at Kauvery Hospital (KCN): A clinical audit
- A case report on rapidly worsening anterior mediastinal mass with metastasis
- Psychological comorbidities in diabetes: An overview
- Management of Cardiac arrhythmias in cardiac critical care
- Fracture neck of femur with alkaptonuria: A case report
- Complex polytrauma: Being “switched on’’ as a vascular surgeon
- PRES (Posterior Reversible Encephalopathy Syndrome): A case series of PRESsing concern
- A successful ERCP in a patient immediately after the PTCA for his recent MI
- Two case reports: What I observed on my elective at Kauvery Hospital at Alwarpet, Chennai
- A shadow of experience as an observer in Kauvery Hospital, Alwarpet, Chennai
- SLE, APS, Pregnancy in Kauvery Hospital, Cantonment
- Monthly Heart Failure audit report on GDMT in Heart City, December 2024
- An ultra-short case report: Reverse Shoulder Arthroplasty
- Diagnostic Images for Ochronosis: One history clinches the diagnosis
- Diagnostic Images: Saccular aneurysm
- Diagnostic Images: Tumor cells in a pancreatic neuroendocrine tumor
- Journal scan: A review of images in clinical medicine of immediate clinical significance, harvested from major international journals
- Chapter 24. How to prepare yourself to survive violent patient encounter?
- மகளிர் தினம்
- Kauverian Editorial: Sepsis Prevention, Heart Failure Care & Clinical Innovation
- Interventions and their impact on Sepsis prevention at NICU
- Evaluation of cefepime-enmetazobactam against ESBL and AmpC β-lactamase producing Gram-negative bacteria: In- vitro study
- Interventions in Acute Ilio-Femoral DVT – 5 Years Institutional Experience
- Molecular diagnosis of infectious diseases
- Monthly Heart Failure audit report on GDMT in Heart city, January 2025
- Assessment of anthropometric parameters and clinical profile as predictors for OSA severity in a tertiary care hospital in South India
- Acute Pulmonary Embolism, highlights of a Kauvery Post Graduate Lecture
- Podcast: Surgical Site Infection – An Overview
- Video: Pathologists’ Role in the Diagnosis in Critical Clinical Situations – A Case-Based Discussion
- A case series: On patients with arrhythmias
- Intravenous Fluid Therapy: A comprehensive review
- A twisted ankle tale: Closed reduction of medial subtalar dislocation in the Emergency department.
- Appendiceal mucosal schwann cell proliferation – rare incidental finding in a case of subacute appendicitis
- Subarachnoid Hemorrhage Due to Ruptured PICA Aneurysm: Endovascular Management and Surgical Intervention
- An ultra-short case report: A patient with severe TVD with LV dysfunction
- An ultra short report with procedural video on SVC obstruction following a stenting
- Diagnostic Images on Molluscum Contagiosum
- Diagnostic Images: Osteomyelitis of L2 Vertebrae
- Journal scan: A review of images in clinical medicine of immediate clinical significance, harvested from major international journals
- Chapter 25. Doctor, are you happy in life?
- Poem: Glaucoma – The Silent Veil
- மருத்துவரின் மகத்துவம் – 2
- Advancing Healthcare Through Research, Innovation and Expertise
- Effectiveness of intraoperative periarticular infiltration in Total Hip Arthroplasty (THA): A clinical audit
- Plasmapheresis & Hemofiltration in poisonings
- Approach to seizures in children: A comprehensive review
- Total Parenteral Nutrition
- Dancing Dragons: A tale of 2 Intriguing Cases
- Multifocal Giant Cell Tumor of the Wrist: Radiologic-Pathologic Correlation and Review of Diagnostic Challenges
- Aortic Dissection: A case report
- Bullous Pemphigoid: A case report
- Chondromyxoid fibroma excision and bone grafting: A case report
- Insights from Diabetes on Wheels: A community-based screening
- An intriguing challenge of unveiling the unexpected: Peripartum cardiomyopathy
- ECMO: The last resort for refractory beta-blocker overdose
- Giant Cell Tumor of talus in a 14-year-old child treated by curettage and cementation: A case report
- Parquet poisoning survival: A rare triumph over a deadly herbicide
- Pituitary Apoplexy with Hypopituitarism: A rare presentation with refractory hyponatremia
- Type 3c Diabetes Mellitus secondary to chronic calcific pancreatitis
- Tuberous sclerosis complex: “When Genes Go Off Script
- Spinal stability restored: A case of odontoid fracture post-trauma
- An ultra-short series of hand replants in quick succession
- First successful neonatal percutaneous cardiac intervention done in Maa Kauvery & Heart city, Trichy.
- Successful Surgical Management of Bilateral Temporomandibular Joint Ankylosis in a Pediatric Patient
- Case Report: Fracture C1 & C2 (Type 3) vertebrae with Atlanto-Axial Dislocation (AAD)
- Diagnostic Image of Fistuloplasty
- Journal scan: A review of images in clinical medicine of immediate clinical significance, harvested from major international journals
- Chapter 26. ‘Mens sana in corpore sano’ – healthy mind in healthy body
- வாழ்வியல் அனுபவம்
- Editorial
- When life paused: A family’s journey through traumatic brain injury
- Early and short term outcomes of an indian bioprosthetic valve at mitral and aortic positions
- Management of Hyperglycemia
- Jigsaw puzzle: A case series on chronic pain condition
- Challenging case of tropical Pyomyositis with metastatic MRSA infection in a De Novo HIV Patient
- Intraventricular astrocytoma causing seizures in a young male
- Silent danger uncovered: Early detection of urinary bladder tumour during routine health screening—a case study
- Mycobacterium leprae, in a case of Hansen disease – Lepromatous type
- A heartfelt beginning: Myopericarditis revealing mixed connective tissue disease
- Clues in the chemistry: Diagnosing Paget’s disease of bone
- Cold Truths in a hot land: Hypothermia unmasked by hypoglycemia in an elderly diabetic
- A case of Plummer Vinson syndrome in an elderly female
- Paradoxical embolism: A video presentation of a case report
- Successful Mechanical Thrombectomy: Two case reports
- TIPS Procedure for severe portal hypertension
- Enhancing patient safety: Innovations in advanced signal detection for pharmacovigilance – A narrative review
- EPS RFA for SVT due to redo-accessory pathways using advanced open window 3D electro-anatomical mapping
- Rest to Recover: How sleep rebuilds mind and body
- CRP levels are influenced by lifestyle and dietary modifications
- An overview of onco-pharmacy in multiple myeloma
- Journal scan
- Editorial
- A case series on ABO -incompatible renal transplantation in a tertiary care hospital, Southern Tamil Nadu
- From first step to final chapter: My journey through Kauvery Hospitals
- Young women and CAD: A retrospective clinical audit at Kauvery Heart City
- Outcome audit: Clinical outcome of stage 2 frozen shoulder treated with Manipulation Under Anaesthesia (MUA) + injection
- Outcome of traumatic brain injury patients with concomitant chest injuries: A retrospective single–center based study
- Consenting and decision making in management of patients
- When fever lingers, think beyond the usual: Consider Kikuchi-Fujimoto disease
- Localizing value of internuclear ophthalmoplegia
- Clinical Snapshots: From the Daily Rounds of My Residency
- Be aware of false positive treadmill traces
- Diagnostic Image: Perineural infiltration
- Achieving better outcomes from intervention by clinical pharmacists
- The role of homocysteine levels as a risk factor of ischemic stroke events: a systematic review and meta-analysis
- The French Paradox: Myth, fact and challenges
- Robotic redo extended hellers cardiomyotomy: An ultra-short report with procedure video
- An ultra-short report on Mechanical thrombectomy for a basilar artery thrombosis
- Diagnostic Images with procedure video: Infarcts in Left temporo occipital lobes
- Middle Meningeal Artery (MMA) embolization, an ultra-short case report and discussion
- Case report of valentine artery: A rare anatomical variation
- The Proceedings of CP Conclave: The Brave New World of Clinical Pharmacy
- Journal scan: A review of images in clinical medicine of immediate clinical significance, harvested from major international journals
- Poem – மருத்துவர் தின வாழ்த்துக்கள்
- Poem – மன அலையின் கூச்சல்
- Editorial
- Audit of antibiotic prescribing patterns before and after ICMR STW implementation in neonatal sepsis
- Guard the Gaze: A comprehensive eye care for a better solution
- An audit on speech and swallow assessment in neuro ICU
- Pulmonary Hypertension: A Cross-Sectional Study from a Tertiary Centre
- Observational, prospective hypertrophic cardiomyopathy registry
- Diagnosis of coagulation disorders
- Eventration of the diaphragm: A rare but critical cause of neonatal respiratory distress
- Femoral nerve block to facilitate painless device closure of atrial septal defect
- Rare cause of infective endocarditis
- Sgarbossa criteria for AMI with LBBB (Left Bundle Branch Block)
- When vitamin B12 deficiency strikes early: A case of pernicious anemia with neurological features
- The missing mineral: Rare cause of reversible cardiomyopathy
- An ultra-short case report: Middle Hepatic Vein (MHV) stenosis
- Optimizing chemotherapy dilution: A clinical pharmacist’s perspective on safe and effective preparation
- Neuroradiology nuggets: Non bifurcating carotid
- Diagnostic Images: Schaumann Bodies
- The serene navigator: Embracing Zero Emotional Noise (ZEN) in healthcare
- Journal scan: A review of images in clinical medicine of immediate clinical significance, harvested from major international journals
- Editorial
- An audit on chemoport-related complication
- Clinical audit: A walk through
- Era of precision medicine in oncology
- The proceedings of IR conclave: “Pinhole Power–Minimally Invasive and Maximally Impactful”
- A case series: The hip thing
- Newer immunomodulators in rheumatoid arthritis: A cautionary tale for cardiologists
- Establishing haemopoietic stem cell transplant services with limited resources, Tiruchirappalli, India
- Neuroradiology nuggets: Fulminant cerebral edema in SLE associated autoimmune encephalopathy
- Chicken bone as a culprit in laparoscopic emergency: A rare case report
- Complete heart block: A rare complication in anterior wall MI
- On the edge of severe DKA: A survival story
- Saving limbs, saving lives: How advanced vascular team treated a rare case
- Successful management of chronic plaque psoriasis with secukinumab in a patient with hematological abnormalities: A 25-year disease history
- Diagnostic Images: Homer Wright Rosettes
- Pregnancy and myasthenia gravis: Clinical course, delivery, and postpartum management, a clinical pharmacist’s report
- Journal scan: A review of images in clinical medicine of immediate clinical significance, harvested from major international journals
- Editorial
- The Advent of Monoclonal Antibodies at Kauvery Hospital, Vadapalani, Chennai, Tamil Nadu, India
- Retrospective analysis and a case report: Chyluria
- Initial management of genitourinary trauma at the triage
- Over-the-scope clip as primary therapy for duodenal ulcer bleed with visible vessel: An alternative to surgery
- Endoscopic palliation of rectosigmoid malignant obstruction using self-expandable metallic stent in advanced colorectal carcinoma
- Duplication of inferior vena cava with an interrupted segment and DVT: A case report
- Breaking blood barriers in transplantation: A case based insight in ABO incompatible kidney transplantation
- Unraveling the beads: A rare case fibromuscular dysplasia presenting as headache in young female
- Vault prolapse: A case report
- Metadiaphyseal presentation of giant cell tumor in adolescent femur: A case report
- Malignant Glomus Tumor: A rare and locally aggressive cancer in a young male
- Beta thalassemia major with acute dengue complications and liver failure
- Overlap or coexistence: Zieve syndrome complicating pancreatitis
- Beyond traditional dentures: Innovative solutions for comfort and aesthetics
- Double infarct (Large AWMI and MCA stroke) simultaneously in a patient who survives a cardiogenic shock with CVA: A video presentation
- A recurrent Subglottis carcinoma treated successfully with TrueBeam LINAC
- Adult-Onset Anti-NXP2 Dermatomyositis and MGUS triggered by COVID-19 vaccination: A clinical pharmacist’s report
- Channelopathies: An integrated review highlighting the clinical pharmacist’s role, with case report
- Neuroradiology Nuggets 3: Visualizing the hidden steal: Multimodal imaging in subclavian steal syndrome
- Nuclear Medicine: Lighting up the invisible
- Diagnostic Images: Adenomatous polyp
- Diagnostic Images: Cirrhotic nodules
- Journal scan: A review of images in clinical medicine of immediate clinical significance, harvested from major international journals